Google Cloud Landing Zone Series – Part 1: Introduction

Welcome to our new blog post series about Landing Zones in Google. In this and the next blog posts, we will explain what is a landing zone, why you need it, describe the components of a landing zone and explain how to setup a landing zone.

What is a Landing Zone

A landing zone, as outlined by Google’s best practices, is a foundational element in constructing an organization’s Google Cloud Platform (GCP) infrastructure. It utilizes an Infrastructure-as-Code (IaC) approach to set up a GCP organization and manage the deployment of resources for various tenants. A tenant, in this context, refers to an independent entity—typically a team responsible for one or more applications—that consumes platform resources.

The rationale behind implementing a landing zone is to streamline and standardize the setup of an organization’s cloud environment. By following established best practices, a landing zone helps prevent the duplication of efforts among tenants, ensures the use of shared components, and enforces adherence to agreed-upon policies. All environment setups are done through approved IaC methods.

Why do we need a Landing Zone

The benefits of deploying a Landing Zone include:

A landing zone for the cloud is essential for several key reasons, especially for organizations looking to deploy and manage their cloud environments effectively and securely. Here are the primary reasons why a landing zone is needed:

1. Standardization: A landing zone provides a standardized approach to setting up and configuring cloud environments. This ensures that all deployments follow the same best practices, configurations, and security standards, leading to consistency across the organization’s cloud infrastructure. This also helps in reducing unnecessary complexity: Solutions are designed following a predefined methodology.

2. Security and Compliance: By establishing a set of security baselines and policies from the outset, a landing zone helps ensure that all cloud resources comply with the organization’s security requirements and regulatory standards. This preemptive approach to security greatly reduces the risk of vulnerabilities and breaches. As such, strengthening security posture is achieved by a common framework for security, access control, and patch management for improving security and compliance.

3. Efficiency and Scalability: With a landing zone, organizations can automate the provisioning of cloud resources, making it easier to scale up or down based on demand. This automation not only speeds up the deployment process but also reduces the likelihood of human error, contributing to a more reliable and efficient cloud environment.

4. Cost Management: Landing zones can help organizations avoid unnecessary costs by ensuring that resources are efficiently allocated and used. Through governance and standardized tagging, it becomes easier to track and manage cloud spending across different departments or projects.

5. Simplified Governance: A landing zone provides a framework for governance, allowing organizations to enforce policies, monitor compliance, and manage access control effectively. This simplifies the governance of cloud resources and helps maintain order as the cloud environment grows. For example, this helps inavoiding unmanaged project sprawl, which s achieved by deploying projects within a standard structure, using consistent naming conventions, and a uniform approach to labeling resources.

6. Faster Time to Market: By streamlining the setup process and enabling automation, landing zones reduce the time it takes to deploy new applications or services. This faster deployment capability can provide a competitive advantage by allowing organizations to bring solutions to market more quickly.

7. Resource Isolation: Landing zones can be designed to isolate resources between different environments (e.g., development, testing, production) or between different projects or tenants. This isolation enhances security and operational efficiency by preventing unintended interactions between resources.

8. Improving reliability: The use of automation, immutable infrastructure, and standardized monitoring, logging, and alerting mechanisms enhance system reliability.

9. Delegating resource management: Tenants are empowered to create and manage their resources within the landing zone framework, ensuring flexibility within a controlled environment.

In summary, landing zones are foundational to building a secure, efficient, and scalable cloud environment. They enable organizations to deploy cloud resources in a controlled, automated, and consistent manner, paving the way for innovation and growth while minimizing risks and costs.

What do you get?

After talking about the benefits of a Landing Zone, let’s talk about what you get with a Landing Zone. 

1. Standardization and Efficiency: Landing Zones provide a repeatable, consistent approach for deploying cloud services using a standardized set of tools and Infrastructure-as-Code (IaC). This methodology prevents unnecessary duplication of effort and limits the proliferation of disparate products by employing curated and endorsed design blueprints as IaC.

2. IaC Capabilities:

A Landing Zone should be build by means of IaC. In order to have a repeatable set of components, the following elements can be provided:

Tenant Factory: Enables the creation of a top-level folder for a tenant along with an associated service account. In terms of Google, this is about configuring the Google organization.

Project Factory: Allows tenants to create their own projects using their service accounts, ensuring that resources are deployed exclusively via IaC and service accounts, except in sandbox projects where experimentation is allowed. With such a Project Factory, workload can later easily be onboarded with the Google Cloud.

CI/CD Toolchain: Facilitates automation and consistent deployment practices. We recommend using GitLab and GitLab CI, as already comes with support for Terraform.

3. Enforcement of Infrastructure Automation: To maintain consistency and agility, the use of infrastructure automation is enforced, preventing configuration drift and aligning with principles of automation and immutable infrastructure. This ensures that outcomes are predictable and that manual console-based configurations, which undermine consistency, are avoided. This involves not only using Terraform, but also have the “right DevOps workflows”, so that automation is done right.

4. Organizational Hierarchy and Policies:

Supports the creation of multiple isolated tenants within a platform, each with the autonomy to manage their own resources within defined boundaries.

Enforces a set of organization-wide policies aligned with best practices for security, such as preventing the creation of default networks, external IP addresses on compute instances, and mandating the use of OS Login for SSH access.

5. Predefined Network Topology:

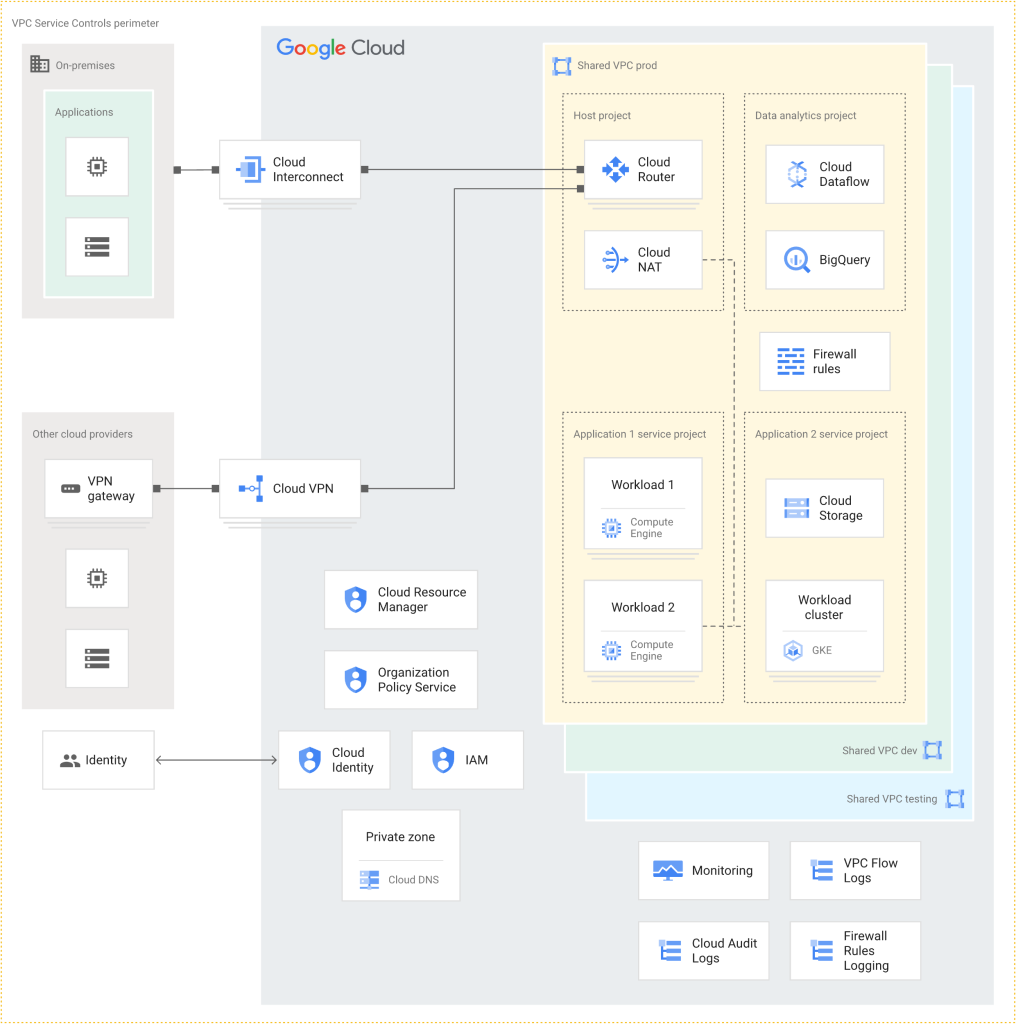
Options for network topology include a shared VPC model or a hub-and-spoke pattern, promoting efficient resource allocation and connectivity among tenants while maintaining security through centralized control mechanisms like ingress and egress patterns. 

Like other hyperscalers, Google already provides architectural guidelines and sample architectures for  Landing Zones. For example, in the following, we can see a design from Google.

A detailed diagram representing the architecture of Google Cloud Landing Zones. On the left, 'On-premises' applications are connected via 'Cloud Interconnect' to Google Cloud's 'Shared VPC prod'. There's also a connection from 'Other cloud providers' through a 'VPN gateway' to a 'Cloud VPN'. 'Identity' is managed by 'Cloud Identity' and 'IAM' for identity and access management. In the center, Google Cloud's infrastructure is outlined, with services like 'Cloud Router', 'Cloud NAT', and 'Cloud Resource Manager'. There are also organizational tools such as the 'Organization Policy Service'. The diagram depicts two separate application service projects labeled 'Workload 1' and 'Workload 2', each containing 'Compute Engine' instances, and a 'Workload cluster' with 'GKE' for containerized applications. 'Cloud Storage' is also part of the setup. On the right, the data analytics project is connected, featuring services like 'Cloud Dataflow' and 'BigQuery'. The entire setup is monitored and secured by 'VPC Flow Logs', 'Cloud Audit Logs', and 'Firewall Rules Logging'. The private zone managed by 'Cloud DNS' is also noted. The network is segmented into production and development environments, with firewall rules ensuring secure access controls.

We at Soeldner Consult have a strategic partnership with CloudGems, for building Landing Zones in a very short time. Cloud Gems have their own design for a Landing Zone, which is very flexible and can be used in regulated environments as well as in traditional industries.

Internal Developer Platform – Part 5: Spotify Backstage

Introduction to Backstage

After having written a lot about IDPs in general, it is now time to shift our focus on Spotify Backstage in the next blog posts. Let’s begin with a general introduction.

The Essence and Adoption of Backstage

Backstage is a comprehensive framework designed to go beyond the traditional scope of Internal Developer Portals by offering an open platform capable of constructing tailored developer portals. Distinct from being a standalone Internal Developer Portal written in the blog post series before, Backstage enables development teams to create a portal that align with their specific requirements. Its ongoing development under Spotify underscore its credibility and the innovative approach towards addressing common developmental and operational challenges.

Due to its effectiveness and versatility, Backstage has seen widespread adoption across the tech industry, with over 1000 organizations and more than a million individual developers leveraging the platform. Among its notable users are big IT enterprises such as Netflix, Zalando, and DAZN, showing the platform’s capacity to serve a diverse range of development environments and organizational sizes. This widespread adoption is further validated by Backstage’s inclusion in the „Incubating Projects“ of the Cloud Native Computing Foundation (CNCF), highlighting its potential for future growth and evolution within the cloud-native ecosystem.

The drive behind Backstage’s development was Spotify’s own experience with rapid growth, which brought about significant infrastructural fragmentation and organizational complexities. These challenges, common in fast-scaling tech environments, led to inefficiencies, including reduced productive time for developers and increased cognitive load due to constant context-switching and the need for navigating disparate tools and systems. Backstage was conceived as a solution to these challenges, aiming to streamline and centralize the development process through a unified platform that abstracts away the complexity of underlying infrastructures and toolsets.

Centralization and Customization Through Backstage

Key to Backstage’s functionality is its ability to serve as a central hub for various development-related activities and resources. It offers platform teams the tools to consolidate engineering and organizational tools, resources, technical documentation, and monitoring capabilities for CI/CD pipelines and Kubernetes, among other features. This centralization is facilitated by a user-friendly visualization layer and a variety of self-servicing capabilities, which are foundational to the philosophy of Internal Developer Portals (IDPs). These features are designed to empower developers by providing them with the means to manage software components, rapidly prototype new software projects, and access comprehensive technical documentation—all within a single, integrated platform.

Furthermore, Backstage’s extensible, plugin-based architecture encourages the integration of additional platforms and services, enabling teams to customize and expand their developer portals according to evolving needs. This architecture supports a vibrant ecosystem of plugins, contributed by both external developers and Spotify’s own engineers, available through the Backstage marketplace. This ecosystem not only enhances the platform’s capabilities but also fosters a community of practice around effective development operations (DevOps) and platform engineering principles.

In summary, Backstage represents a strategic tool for addressing the complexities and inefficiencies associated with modern software development and platform engineering. Its development is a response to real-world challenges faced by one of the most innovative companies in the tech sector, and its adoption by leading tech firms underscores its value and effectiveness. Through its comprehensive suite of features, flexible architecture, and supportive community, Backstage offers a promising pathway for organizations looking to enhance their development practices and infrastructure management.

The following table summarizes these keypoints:

AspectDetails
Nature of BackstageAn open framework for creating tailored Internal Developer Portals, not just a portal itself.
Development and AdoptionDeveloped by Spotify, with over 1000 adopters and more than a million developers. Notable users include Netflix, Zalando, and DAZN.
CNCF InclusionIncluded in the „Incubating Projects“ of the Cloud Native Computing Foundation (CNCF), indicating potential for growth.
Purpose and OriginCreated to address Spotify’s challenges with infrastructural fragmentation and organizational complexities during rapid growth.
Core FunctionalityServes as a central hub for development tools, resources, technical documentation, and monitoring of CI/CD pipelines and Kubernetes.
Self-Servicing CapabilitiesEmpowers developers with tools for managing software components, prototyping, and accessing technical documentation.
ArchitecturePlugin-based, allowing for integration of additional services and customization to meet evolving needs.
Community and EcosystemSupported by a vibrant ecosystem of plugins, contributed by both Spotify and external developers, available on the Backstage marketplace.

For integrating Backstage into a productive environment, Spotify recommends delegating the portal’s maintenance and development to a dedicated Platform Team. This team is tasked with ensuring that both internal developers and other infrastructure and platform teams transition to actively using the portal. The goal is to establish Backstage as the central platform for all software development activities within the organization. To facilitate the platform’s adoption, Spotify suggests various tactics and identifies metrics to measure the adoption process. These tactics and metrics, while described in the context of Backstage, could generally apply to the adoption of any Internal Developer Platforms or portals. Additionally, the Platform Team is responsible for implementing best practices in consultation with technical leaders or architects.

Internal Developer Platform – Part 4: Deployment Options

In this blog post, we want to discuss the pros and cons of the different deployment options

Deployment options

When introducing an Internal Developer Platform (IDP), companies have basically two option: building it in-house or acquiring a complete package from an external service provider. For in-house development, the responsibility lies with the operations team or a designated „Platform Team“ within the company. This team’s primary functions include creating, further developing, and maintaining the IDP. They closely interact with other organizational members to identify issues at the team and company levels, set basic configurations for applications, and manage permissions. Additional tasks involve ensuring „Standardization by Design,“ managing infrastructure, Service Level Agreements, optimizing workflows, and configuring the IDP to automate recurring processes.

Contrastingly, the Platform-as-a-Service (PaaS) approach involves an external provider offering the platform, taking on these responsibilities. Companies with specific IDP requirements and an in-house Platform Team generally prefer self-development. Instead of starting from scratch, the team can utilize various tools and services to assemble the platform. These tools and services, categorized into platform orchestrators, portals, service catalogs, Kubernetes Control Planes, and Infrastructure Control Planes like Terraform and GitLab CI, each handle specific functionalities of an IDP. Existing tools and technologies like PostgreSQL, Kubernetes, and GitLab CI can be integrated into the IDP.

Backstage Tech Stack

A potential tech stack for an IDP might include Backstage, serving as an internal developer portal with features like a software catalog and tools for monitoring and technical documentation management. Backstage can be extended through plugins for new functionalities. ArgoCD, a GitOps tool, would handle dynamic application deployment in Kubernetes clusters, while Terraform allows developers to provision the desired infrastructure. In addition, companies like Soeldner Consult offer ready to use GitOps plug-ins for the self-service of infrastructure deployments.

Cost considerations

Tool selection often considers cost structures, with distinctions mainly in usage-based or ongoing expenses. While open-source tools like Backstage, ArgoCD, and PostgreSQL are available for free, commercial tools like the Internal Developer Portals „Roadie“ or „configure8“ have usage fees. Despite being open-source, some tools may incur costs for underlying infrastructure operation or developer effort for setup and maintenance. 

Along with the complex cost structure, differences in integration concepts, scope, and hosting models must be considered when selecting tools. The self-development of IDPs presents challenges like increased effort and a steep learning curve for tool implementation, necessitating a capable platform team with the necessary knowledge and resources. While complex configurations may prolong the IDP’s readiness, self-development offers design freedom, allowing the platform team to tailor the platform to specific requirements.

IdP for Startups

For startups, small companies, or organizations lacking the necessary resources and knowledge to independently develop and operate an Internal Developer Platform (IDP), leveraging pre-built solutions from third-party providers might be a practical choice. This route bypasses the complex tasks of setup, maintenance, and further development, as they are primarily executed by the third-party vendor. Similar to custom development, both open-source and closed-source ready-made solutions are available. Typically, these solutions are offered as „Platform-as-a-Service“ (PaaS) products, encompassing a wide array of toolsets. „Mia-Platform“ and „Coherence“ are examples of such platforms. Many providers also allow for the integration of services from external providers, like GitHub repositories or Kubernetes tools, and often feature their own developed tools designed to be integrated into the IDP.

Most providers offer official support, a benefit not always guaranteed with self-developed IDPs. The focus on the IDP concept varies by provider, with some covering the entire software development process as an „End2End“ development process, while others, particularly open-source solutions, may offer only parts of the IDP’s task spectrum. Currently, a comprehensive IDP that is distributed as open-source but also covers most features of a closed-source software does not seem to exist. Closed-source products are generally offered for a monthly fee, with costs dependent on factors like team size, the number of builds completed per month, or the underlying infrastructure used. Due to the predominantly closed-source approach, there is an expectation of reduced design flexibility in the setup and operation of the platform, as well as an increased dependency on the third-party provider.

Internal Developer Platforms – Part 3: Components of IDP’s

Understanding the Components of Internal Developer Platforms (IDP)

After having motivated the advantages of an IDP, we want to focus on the components of an IDP: Internal Developer Platforms (IDP) are designed to streamline and enhance the efficiency of development tasks through a variety of integrated tools and technologies. These platforms comprise six core components that work together to create a cohesive development environment. 

1. Application Configuration Management (ACM) allows you to centralize the management of application configurations. This makes for more convenient management of configurations and enhances service capabilities for such scenarios as microservices, DevOps, and big data. ACM is essential for managing application configurations in a standardized, scalable, and reliable manner. This includes handling various configurations often stored in YAML files, facilitating easier setup changes, versioning, and maintenance. ACM also relates with a proper GitOps strategy, Infrastructure Orchestration (for example with Terraform or Helm) and Environment Management

2. Infrastructure Orchestration (IO): This component integrates the IDP with existing technology setups, including CI/CD pipelines and hardware infrastructure. It ensures that images created during the CI process are correctly deployed into environments like Kubernetes clusters, potentially managed through service accounts provided by cloud operators. Typically, technologies like Terraform or Ansible are used.

3. Environment Management (EM): EM enables developers to create, update, and delete fully provisioned environments at any time without operations team intervention. This promotes efficiency and cost savings by avoiding unnecessary operational expenses and delays. Once again GitOps and a proper GitOps strategy alongside with Infrastructure Orchestration and Deployment Management is crucial.

4. Deployment Management (DM): Focused on integrating CI/CD pipelines, DM allows developers to concentrate on coding by automating building, testing, and deployment processes. This includes selecting the correct environment for image deployment and keeping a record of all deployments for auditing and debugging purposes. Tools like GitLab CI, Tekton or Argo will be a good choice for the integration into to IDP.

5. Role-Based Access Control (RBAC): RBAC controls who can access what within the IDP. By defining roles like Member, Manager, and Admin, IDPs ensure that access is appropriately managed, minimizing unauthorized access and tailoring permissions to the environment type—production or development.

6. Self-Servicing: This feature enables developers to use IDP services without relying on other teams. Self-servicing can be implemented through no-code solutions like graphical user interfaces or through more open solutions like command-line interfaces (CLIs) and APIs. It encompasses accessing templates, creating microservices, and managing software components, promoting a culture of collaboration and innovation across teams and stakeholders.

By integrating these components, Internal Developer Platforms empower developers to work more autonomously, streamline processes, and enhance collaboration across teams, leading to more efficient and innovative development practices.

Summary of Components

The following table recaps these components:

ComponentDescription
Application Configuration Management (ACM)Manages app configurations in a scalable way, simplifies setup changes, and maintains version control.
Infrastructure Orchestration (IO)Integrates with existing tech tools like Terraform and Ansible and manages the underlying infrastructure
Environment Management (EM)Allows for the creation and management of applicationenvironments.
Deployment Management (DM)Integrates with CI/CD pipelines, enabling developers to focus more on coding than on deployment logistics.
Role-Based Access Control (RBAC)Manages user permissions within the IDP, ensuring secure and appropriate access.
Self-ServicingProvides developers with tools and services for efficient and autonomous project management.

Introducing an IDP

After having discussed the components of an IDP, let’s now discuss how to introduce an IDP in an enterprise environment.

When introducing an Internal Developer Platform (IDP), there are primarily two approaches: self-development or acquisition from an external provider as a complete package. In the case of self-development, the task usually falls to the Operations Team or a designated „Platform Team“ within the company. This team is primarily responsible for creating, developing, maintaining, and optimizing the IDP while ensuring it meets organizational needs.

The Platform Team maintains close communication with the rest of the organization to identify issues at both the team and corporate levels. Their responsibilities include setting basic configurations for applications, managing permissions, ensuring standardization by design, managing infrastructure, service level agreements, optimizing workflows, and configuring the IDP to automate recurring processes.

Alternatively, the Platform as a Service (PaaS) approach involves using a platform provided by an external provider, who takes over the tasks mentioned above.

Companies with specific IDP needs and a capable Platform Team usually prefer the self-development route. Instead of building from scratch, teams can utilize various tools and services to assemble the platform, such as platform orchestrators, portals, service catalogues, Kubernetes control planes, and infrastructure control planes. They can also integrate common tools and technologies, possibly already in use internally, like PostgreSQL databases, Kubernetes for infrastructure, Harbor for image registries, and GitLab CI for continuous integration.

A typical IDP tech stack might include tools like Backstage for internal developer portals, ArgoCD for GitOps, and Terraform for infrastructure provisioning. While some of these tools, like Backstage and ArgoCD, are open-source and free to use, others may have different cost structures, including usage fees. The selection of tools involves considering cost structures, integration concepts, scale, and hosting models. Self-development offers design freedom but comes with challenges such as the increased effort, steep learning curves, and lack of official support for open-source tools, which may necessitate extensive research for technical problems.

Summary of IDP Implementations

ApproachTeam involvedKey responsibilitesBenefitsChallenges
Self-DevelopmentPlatform TeamBuilding and maintaining IDP Managing permissions Standardization and workflow optimizationCustomizability; Integration with existing toolsHigher effort and learning curve Costs for infrastructure and setup
Lack of official support
PaaS (External)External ProviderProviding and maintaining IDP Managing infrastructure and permissionsReduced internal workload Professional supportLess control and customization Potential ongoing costs

Internal Developer Platforms – Part 2: What is an IPD?

What is an Internal Developer Platform (IDP)?

After having introduced Internal Developer Platform in our first blog post of this series, we want to talk about the features of an IDP in more details and write why IDPs matters for companies within a cloud transformation.

First, the concept of an IDP basically consists of three main components:

Firstly, „Internal“ signifies that the platform is designed for use exclusively within an organization. Unlike public or open-source tools, an IDP is tailored to meet the specific requirements and security standards of the company. This focus ensures that internal workflows, data, and processes remain secure and optimized for the company’s unique ecosystem.

Secondly, the „Developer“ component highlights that the primary users of these platforms are the application developers within the organization. The platform is designed with the needs of developers in mind, aiming to streamline their workflows, improve efficiency, and enhance productivity. By centralizing tools and resources, an IDP reduces the complexity developers face, allowing them to focus more on coding and less on administrative or setup tasks.

Thirdly, „Platform“ denotes that the IDP serves as a foundational framework combining various development, deployment, and operational tools into a cohesive environment. This includes integration with version control systems, continuous integration (CI) tools, GitOps practices, databases, and container technologies. By bringing these elements together, the platform facilitates a more streamlined and coherent development lifecycle.

The main objective of an IDP is to simplify and enhance the developer experience by automating processes, centralizing resources, and eliminating unnecessary manual tasks. This includes enabling developers to request resources, initiate pre-provisioned environments, deploy applications, and manage deployments with greater ease and efficiency. As a result, the deployment process, in addition to development, becomes part of the developer’s realm, increasing control and agility.

An IDP typically requires only a coding environment, the Git tool for version control and merging, and the platform itself. This consolidation reduces the need for external websites or the creation of superfluous scripts to execute certain processes or actions, thereby streamlining the entire application development process.

Internal Developer Platforms are generally developed by a dedicated in-house team, known as the Platform Developer Team, which ensures that the platform is customized to fit the company’s needs and goals. However, for companies lacking the resources or expertise to develop their own IDP, there are Platform-as-a-Service (PaaS) options available, providing a complete, out-of-the-box solution from various vendors.

In contrast to IDPs, the term „Internal Developer Portal“ is occasionally mentioned in literature. While it can be used interchangeably with IDP in some contexts, most sources differentiate between the two. The Internal Developer Portal is typically understood as the graphical user interface (GUI) of the IDP, through which developers and sometimes automated systems interact with the platform’s tools and services. This interface simplifies the user experience, making the platform’s functionality more accessible and intuitive.

The Importance of Self-Service

The concept of self-service is a crucial aspect of Internal Developer Platforms (IDP) and significantly enhances their value and utility for developers. Self-service mechanisms within an IDP empower developers by giving them the autonomy to access resources, tools, and environments directly, without needing to wait for approval or intervention from IT operations or other departments. This approach accelerates workflows, promotes efficiency, and reduces bottlenecks in the development cycle.

In a self-service oriented IDP, developers can perform a variety of actions independently. For example, they can request and allocate computational resources, initiate pre-configured environments, deploy applications, and set up automated deployments. Additionally, they can manage scaling, monitor performance, and if necessary, roll back to previous versions of their applications without external assistance. This autonomy not only speeds up the development process but also encourages experimentation and innovation as developers can try out new ideas and solutions quickly and easily.

The self-service capability is underpinned by a user-friendly interface, typically part of the Internal Developer Portal, which simplifies complex operations and makes them accessible to developers of varying skill levels. By abstracting the underlying complexities and automating repetitive tasks, the IDP allows developers to focus more on their core activities, such as coding and problem-solving, rather than on infrastructure management.

Moreover, self-service in IDPs is often governed by predefined policies and templates to ensure that while developers have the freedom to access and deploy resources, they do so in a manner that is secure, compliant, and aligned with the company’s standards and practices. This balance between autonomy and control helps maintain the organization’s operational integrity while enabling the agility required in modern software development.

In summary, self-service is a key feature of Internal Developer Platforms that transforms the developer experience by providing direct access to tools and resources, thereby streamlining the development process, fostering independence, and enabling a more agile and responsive development cycle.

The following table summarizes these elements

FeatureDescription
Developer AutonomyDevelopers can independently access resources, tools, and environments, eliminating the need for IT operations or other departments‘ intervention.
Speed and EfficiencySelf-service capabilities accelerate workflows and reduce bottlenecks, enabling faster development cycles and promoting efficiency.  
Innovation and ExperimentationEmpowers developers to quickly try new ideas and solutions without prolonged setups or approvals, fostering a culture of innovation.           
User-Friendly InterfaceTypically part of the Internal Developer Portal, it simplifies complex operations, making them accessible and manageable for developers of all skill levels
GovernanceWhile offering freedom, self-service is governed by predefined policies and templates to ensure security, compliance, and adherence to company standards

That’s for this post. In the next post, we will talk about the internal components of an IDP.

Internal Developer Platforms – Part 1: Introduction

In recent years, the software development landscape has undergone significant changes, with terms like „Containerization,“ „Microservices,“ and „Cloud“ becoming increasingly influential. These technologies represent just the tip of the iceberg in a vast array of tools and practices shaping modern software development. The field is continuously evolving, with Artificial Intelligence tools now becoming part of developers‘ everyday toolkit.

Pain Point: Cognitive Load

As the complexity of IT infrastructure grows, so does the cognitive load on developers. They are expected to navigate an ever-expanding universe of tools and technologies, even for basic tasks such as app deployment. This scenario is challenging because developers‘ primary focus should be on coding and creating software efficiently.

Solution: Internal Developer Platform

To address these challenges, leading tech companies like Spotify, Google, Netflix, and Github have developed Internal Developer Platforms (IDPs). These platforms aim to simplify the development process by integrating existing infrastructures and tools, thereby facilitating information exchange throughout the software development lifecycle. IDPs serve to abstract away the underlying complexity, allowing developers to focus more on their primary tasks and less on the intricate details of the technology stack.

The rising interest in such platforms suggests a shift towards more streamlined, efficient development environments. As this trend continues, delving deeper into the technology and understanding its implications for software development could prove beneficial. The ongoing evolution underscores the importance of adapting to new tools and practices in the ever-changing landscape of software development.

Basic Features

Increasingly, cloud providers are offering tools that extend beyond the standard Integrated Development Environment (IDE) to assist developers with ancillary tasks such as management, deployment, and observability. These tools are part of internal platforms, setting them apart from public services like Github, which focus on code management. Recent examples of Internal Developer Platforms (IDPs) include Atlassian and Gitlab. IDPs serve as central hubs, often featuring a „cockpit“ that provides an overview of resources and statuses. Some now incorporate AI to help with routine tasks. The aim of these platforms is to enhance the Developer Experience and reduce cognitive load.

Solutions on the market

More and more commercial vendors provide an IDP based on Spotify Backstage. 

For example, at RedHat,  the core of the Developer Hub announced in May 2023 a self-service portal based on Backstage, where developers can find all the necessary resources for their work, including a software catalog, documentation, and best practices. The portal also offers standardized software templates and pipelines, aiming to simplify the often cumbersome deployment process. For example, Red Hat aims to reduce the cognitive load on teams and make onboarding easier for new members.

Adopting the plugin concept from the underlying Backstage project, vendors have released its own plugins, which are available to customers and the Backstage community. These plugins enhance the portal with features for Continuous Integration/Continuous Delivery (CI/CD), Observability, or Container Management, and the IDP is capable of running non-Red-Hat plugins as well.

The graphic shows the interest in Spotify Backstage over time. The interest is increasing.

Part 10: Supply Chain – Configuring Tekton Chains and Tekton Dashboard

Introduction

This is the last blog for our Tekton tutorial. In the last blog posts, we discussed how to install and configure Tekton. Now we want to briefly discuss how to configure Tekton Chains and the Tekton dashboard.

Tekton Chains

As discussed, an important requirement of the SLSA framework is attestation. Tekton provides Tekton Chains for that, which is part of the Tekton ecosystem.

In addition to generating attestation, Tekton Chains makes it possible to sign task run results with, for example, x.509 certificates or a KMS and store the signature in one of numerous storage backends. Normally the attestation with the artifact is stored within the OCI store. It is also possible to define a dedicated storage location independent of the artifact. Alternative storage options include Sigstor’s record servers, document stores such as Firestore, DynamoDB and Mongo and Grafeas.

An important aspect of Tekton Chains is the ability to integrate the Sigstor project. This also refers to Fulcio and Rekor, which were explained in more detail here. SLSA’s requirements for provenance, (which can be solved by Rekor and Fulcio), were that keys must be stored within a secure location and that there is no possibility for the tenant to subsequently change the attestation in any way . Although key management via a KMS is just as valid as using Fulcio and both solutions would meet the requirements of SLSA, Rekor, in particular, satisfies the requirement of immutability. As already mentioned, Rekor’s core is based on Merkle trees, which make deletion or modification impossible. Both Fulcio and Rekor represent an important trust connection between producer and consumer through the services provided by Sigstore.

Tekton Chains offers the advantage that neither the signature nor the attestation need to be provided through custom steps in the pipeline itself. For example, even if a developer integrates Cosign into a task to sign an image, Chains works regardless. The only requirement in the pipeline are the so-called ‘Results’. These allow Tekton to clearly communicate which artifacts should be signed. Results have two areas of application. A result can be passed through the pipeline into the parameters of another task or into the when functionality, or the data of a result can be output.

The data output by results serves the user as a source of information, for example about which digest a built container image has or which commit SHA a cloned repository has. The Tekton Chains Controller uses Results to determine which artifacts should be attested. The controller searches for results of the individual tasks with the ending “*_IMAGE_URL” and “*IMAGE_DIGEST”, where the IMAGE URL is the URL to the artifact, IMAGE_DIGEST is the digest of the artifact and the asterisk is any name.

Tekton Dashboard

The Tekton dashboard is a powerful tool that makes managing Tekton easier. The dashboard can be used in two modes: read only mode or read/write mode.

The authorizations of the dashboard can be configured by means service accounts, as is typical for Kubernetes. However, this poses a problem because the dashboard itself does not come with authentication or authorization in either mode. There are no options for regulating the dashboard’s permissions through RBAC. In this case, RBAC would only apply to the dashboard’s ServiceAccount, but not to all users. In practice, this means that all authorizations that the Tekton Dashboard service account has also apply to the person accessing the dashboard. This is a big problem, especially if the dashboard is public accessible.

Kubernetes does not have native management of users because – unlike service accounts – they are not manageable objects of the API server. For example, it is not possible to regulate authentication via user name and password. However, there are several authentication methods that use certificates, bearer tokens or authentication proxy.

Two of these methods can be used to secure the Tekton dashboard. On the one hand, OIDC tokens and on the other hand, Kubernetes user impersonation.

OIDC is an extension of the Open Authorization 2.0 (OAuth2) framework. The OAuth2 framework is an authorization framework that allows an application to carry out actions or gain access to data on behalf of a user without having to use credentials. OIDC extends the functionality of OAuth 2.0 by adding standardizations for user authentication and provision of user information.

Kubernetes user impersonation allows a user to impersonate another user. This gives the user all the rights of the user they are posing as. Kubernetes achieves this through impersonation headers. The user information of the actual user is overwritten with the user information of another user when a request is made to the Kubernetes API server before authentication occurs.

There are different tools to achieve this. One of this tools is Open Unison from Tremolo. Open Unison offers some advantages. It is possible to implement single sign-on (SSO) for graphical user interfaces and session-based access to Kubernetes via the command line interface. When using Openunison or similar technologies, communication no longer takes place directly with the Kubernetes API server, but rather runs via Open Unison. Open Unison uses Jetstack’s reverse proxy for OIDC.

When a user wants to access the Tekton dashboard, Open Unison redirects the user to the configured Identity Provider (IDP). After the user has authenticated himself with the IDP, he receives an id_token. The id_token contains information about the authenticated user such as name, email, group membership or the token expiration time. The id_token is a JavaScript Object Notation Web Token (JWT)

The reverse proxy uses the IDP’s public key to get the id_to to validate. After successful validation, the reverse proxy appends the Impersonation header to the request to the Kubernetes API server. The Kubernetes API server checks the Impersonation header to see whether the impersonated user has the appropriate permissions to execute the request. If so, the Kubernetes API server executes the request as an impersonated user. The reverse proxy then forwards the response it received from the Kubernetes API server to the user.

The following steps describe the configuration of the dashboard with OAuth2:

Create a namespace:

kubectl create ns consumerrbac

Installation of Cert Manager:

helm install \                                                                                                                   

  cert-manager jetstack/cert-manager \

  –namespace consumerrbac \

  –version v1.11.0 \

   –set installCRDs=true

In order to create certificates, an issuer is needed:

apiVersion: cert-manager.io/v1

kind: Issuer

metadata:

  name: letsencrypt-prod

  namespace: consumerrbac

spec:

  acme:

    server: https://acme-v02.api.letsencrypt.org/directory

    email:

    privateKeySecretRef:

      name: letsencrypt-prod

    solvers:

    – http01:

        ingress:

          class:  nginx

Now nginx, can be installed:

helm install nginx-ingress ingress-nginx/ingress-nginx –namespace consumerrbac

Now, the ingress can be created.

apiVersion: networking.k8s.io/v1

kind: Ingress

metadata:

  name: tekton-dashboard

  namespace: tekton-pipelines

  annotations:

    kubernetes.io/ingress.class: “nginx”

    nginx.ingress.kubernetes.io/auth-url: http://oauth2-proxy.consumerrbac.svc.cluster.local/oauth2/auth

    nginx.ingress.kubernetes.io/auth-signin: https://dashboard.35.198.151.194.nip.io/oauth2/sign_in?rd=httpd://$host$request_uri

    nginx.ingress.kubernetes.io/ssl-redirect: “false”

spec:

  rules:

  – host: dashboard.35.198.151.194.nip.io

    http:

      paths:

      – pathType: Prefix

        path: /

        backend:

          service:

            name: tekton-dashboard

            port:

              number: 9097

OAuth Proxy (we use Google and exptect the application created there):

  • In the Google Cloud dashboard, select APIs & Services
  • On the left, select Credentials
  • Press CREATE CREDENTIALS and select O Auth client ID
  • For Application Type, select Web application
  • Give the app a name and enter Authorized JavaScript origins and Authorized redirect URIs
  • Click Create and remember Client ID and Client Secret
  • A values.yaml must be created for the installation.
config:

  clientID:

  clientSecret:


extraArgs:

  provider: google

  whitelist-domain: .35.198.151.194.nip.io

  cookie-domain: .35.198.151.194.nip.io

  redirect-url: https://dashboard.35.198.151.194.nip.io/oauth2/callback

  cookie-secure: ‘false’

  cookie-refresh: 1h

Configuration of Open Unison

Create a namespace:

kubectl create ns openunison

Add Helm repo:

helm repo add tremolo https://nexus.tremolo.io/repository/helm/

helm repo update

Before openunison can be deployed, the oauth must be configured in the Google Cloud.

  • In Credentials, under Apis & Services, click CREATE CREDENTIALS
  • Then on OAuth Client ID
  • Select Web application as the application type and then give it a name
  • Authorized JavaScript origins: https://k8sou.apps.x.x.x.x.nip.io

Now Open Unison can be installed:

helm install openunison tremolo/openunison-operator –namespace openunison

Finally, Open Unison has to be configured with the appropriate settings.

This concludes our series on Tekton. Hope you enjoyed it.

Part 9: Supply Chain – Workspaces and Secrets

Introduction

As mentioned in the last blog post, the next thing we want to talk about and discuss is authentication, workspaces and secrets. Let’s begin with Workspaces.

Workspaces

As already mentioned, in Tekton each task is run in a pod. The concept of workspaces exists in Tekton so that pods can share data between each oterh. Workspaces can also help with other thins: Workspaces can be used to mount secrets, config maps, tools or a build cache in a pod. Tekton Workspaces work similarly to Kubernetes Volumes. This also applies to their configuration.

The configuration of the workspace is done in the pipeline, task run or in a TriggerTemplate.

Configuring a workspace is very similar to configuring a Kubernetes volume. This example creates a workspace that is used to mount the Dockerfile and associated resources from the pod that clones the repository to the pod that builds and uploads the image. In Tekton, VolumeClaimTemplates are used to create a PersistentVolumeClaim and its associated volume when executing a Task or PipelineRun. (Tekton Workspaces, n.d.) The further configuration of the workspaces is similar to that of a PersistentVolumeClaim in Kubernetes. The accessMode specifies how and which pods have access to a volume. ReadWriteOnce means that pods on the same node have read and write access to the volume. The storage space size in this configuration is one Gigabyte.

Of course, the steps to clone the repository and build and upload the container image to a registry require appropriate permissions. This can be done via the two following options:

  • First, the corresponding Kubernetes secrets with the credentials are mounted in the pod.
  • Second, authentication is implemented via a Kubernetes Service Account. The mounted volume is a Kubernetes Secret Volume. The data in this volume is read-only and is managed in the container’s memory via the temporary file system (tmpfs) file system, making the volume volatile. Secrets can be specified under Workspaces in the yaml configuration as follows.

Tekton can also isolate workspaces. This helps to make data accessible only for certain steps in a task or sidecars. However, this option is still an alpha feature and therefore cannot (yet) be used.

Secret Management

Kubernetes secrets are not encrypted by default, only encoded. This means that anyone with appropriate permissions can access the secrets via the cluster or the etcd store. It should also be noted that anyone who has the rights to create a pod has read access to the secrets in the corresponding namespace.

Kubernetes offers two ways to deal with this problem. Option one is the encrypting of secrets in the etcd store. This means that the secrets are still kept within Kubernetes.

Option two involves the utilization of third-party applications and the Container Storage Interface (CSI) driver. In this case, secrets are not managed directly by Kubernetes and are therefore not on the cluster.

One popular tool for the second approach is Hashicorp Vault. Like the other tools, Vault follows the just-in-time access approach. This gives a system access to a secret for a specific time and as needed. This approach reduces the blast radius by compromising the build system.

In addition, this minimizes the configuration effort because extra Role Based Access Control (RBAC) rules for secrets, for example in the namespaces for development, test and production, do not have to be created and the secrets do not have to be stored in this extra.

The Secrets Store CSI Driver makes it possible to mount secrets from Vault, into the CSI. Once the CSI driver knows which secrets should be mounted from the provider, SecretProviderClass objects are configured. These represent custom resources under Kubernetes. When a pod is started, the driver communicates with the provider to obtain the information specified in the SecretProviderClass.

Authentication

In the following two use cases Tekton needs secrets for authentication:

  • Authentication against Git (for example cloning)
  • Authentication against the Container Registry

As described in the last blog post within the PipelineRun example, Secrets can be mounted. The following examples show how to create those secrets:

Both manifest files can be created via the kubectl-command.

If a config.json file does not yet exist, you have to generate it first. To do this, you must log in to the desired registry via docker.

docker login registry.gitlab.com

Within the config.json the credentials from the Docker config.json must be specified in base64 encoded.

cat ~/.docker/config.json | base64

It is important to ensure that this does not happen via Docker Desktop, because then the “credsStore”: “desktop” field is included in the config.json and it must be ensured that the config.json has the following format:

{

        “auths”: {

                “registry.gitlab.com”: {

                        “auth”: “”

                }

        }

}

Furthermore, the secrets can be added to the ServiceAccount, which is specified via the serviceAccountName field.

apiVersion: v1
kind: ServiceAccount
metadata:
  name: build-bot
  namespace: tekton
secrets:
  - name: git-credentials
  - name: dockerconfig

If the credentials are not provided via the ServiceAccount, they must be defined in the pipeline run under the pod template.

podTemplate:
    securityContext:
      fsGroup: 65532
    imagePullSecrets:
    - name: dockerconfig
    - name: git-credentials

After the pipelinerun.yaml has been configured it can be executed

kubectl create -f pipelinerun.yaml

Pipeline run logs can be viewed using the tkn command line tool:

tkn pr logs clone-read-run- -f -n tekton

After the pipeline has run through, you can check whether it has been signed and attested.

kubectl get tr [TASKRUN_NAME] -o json | jq -r .metadata.annotations

Part 8: Supply Chain – Tasks and Pipelines

Pipelines

Now it is time to gain a better understanding of tasks and pipelines. Before we create a pipeline, lets first create a Tekton namespace:

kubectl create ns tekton

In Tekton, a pipeline can consist of one or more tasks, which can be executed one after the other or in parallel with one another.

The pipeline includes the fetch-source, show-content and build-push tasks. Fetch-source clones the repo in which the Dockerfile is located and build-push builds the image and uploads it to a repo. The show-content task displays the artifacts obtained through Fetch-source.

One of biggest of advantages of Tekton is, that not all tasks and pipelines need to be rewritten because Tekton provides a Tekton Hub where users can share their tasks and pipelines with each other. Two tasks from the Tekton Hub were used in this example.

The first task, called Git-clone, clones a Git repository and saves the data to a workspace. Workspaces will be discussed in more detail later.
The second task, originating from the Tekton hub, builds an image and uploads it to any container registry. The task uses Kaniko to build an image. The task also saves the name and a digest of the image in a result so that Tekton Chains can sign the image and create an attestation. Tekton chains and results will be discussed in a later point.

The example of the “git-clone” task shows the name of the task has in the context of the pipeline. The “taskRef” field is used to reference the individual tasks, in this case git-clone. You can also define here which parameters and workspaces should be passed to the task.
The “url” parameter of the task is assigned the “repo-url” parameter. The names of the parameters can differ from pipeline to task. The notation $(params.repo-url) refers to the parameter that is in the “params” field. Parameters that come from a task or pipeline run are set in this field.

In order to use those tasks, we may not forget to install them. Here is the first task:

It can be applied either via tkn oder kubectl apply:

tkn hub install task git-clone

kubectl apply -f https://raw.githubusercontent.com/tektoncd/catalog/main/task/git-clone/0.6/git-clone.yaml

The second task can also be found on Tekton Hub and can be installed as follows:

tkn hub install task kaniko

kubectl apply -fhttps://raw.githubusercontent.com/tektoncd/catalog/main/task/kaniko/0.6/kaniko.yaml

If you have some troubles with the builder image, you might change the appropriate section as follows:

The last task is the show-readme.

To apply the pipeline, we just enter the following command:

kubectl apply -f pipeline.yaml

Installation of Tekton Chains

Since Chains is not installed via the operator, Chains must be installed separately.

kubectl apply –filename https://storage.googleapis.com/tekton-releases/chains/latest/release.yaml

If you prefer to install a special version, you can issue the following command:

kubectl apply -f https://storage.googleapis.com/tekton-releases/chains/previous/${VERSION}/release.yaml

After installation, the configmap can be configured.

Configuration in the manifest:

kubectl patch configmap chains-config -n tekton-chains -p=‘{“data”:{“artifacts.taskrun.format”:”in-toto”, “artifacts.pipelinerun.storage”: “tekton, oci”, “artifacts.taskrun.storage”: “tekton, oci”}}’

Furthermore, the keyless signing mode can be activated, which uses Fulcio from the Sigstore project.

kubectl patch configmap chains-config -n tekton-chains -p=‘{“data”:{“signers.x509.fulcio.enabled”: “true”}}’

Chains supports automatic binary uploads to a transparency log and uses Rekor by default. If activated, all signatures and attestations are logged.

kubectl patch configmap chains-config -n tekton-chains -p=‘{“data”:{“transparency.enabled”: “true”}}’

After the ConfigMap has been patched, it is recommended to delete the Chains Pod so that the changes are registered by the Pod

kubectl delete po -n tekton-chains -l app=tekton-chains-controller


Pipeline Runs

A run, whether TaskRun or PipelineRun, is instantiated and executes pipelines and tasks. When a PipelineRun is executed, TaskRuns are automatically created for the individual tasks. Among other things, the pipeline that is to be executed is referenced, the parameters that are to be used in a task are defined, or the pod templates. A blueprint for the executed pods is created using the templates. For example, environment variables can be provided for each pod and scheduling settings can be configured via nodeSelectors, tolerances and affinities.

After everything has been configured, the pipeline run can be executed.

Within the param section, you can specify the git repo for cloning and also choose where the image should be uploaded to.

So that’s it for today. In the next blog post, we will discuss authentication, workspaces, secrets and more. So there is still a lot of interesting stuff left.

Part 7: Supply Chain – How to work with Tekton

How to work with Tekton

In the last blog post, we briefly discussed what is Tekton and how an installation can take place. In this blog post, we go a step further and show how to work with Tekton when we want to build a Supply Chain.

Let’s start with the installation first:

The components required for Tekton are installed via the Tekton Operator. This can be done in 3 different ways: 

  • Via the Operator Lifecycle Manager
  • With a release file
  • By code

We chose the installation via the release file. However, there is one disadvantage – the lifecycle management has to be taken over by yourself:

kubectl apply -f https://storage.googleapis.com/tekton-releases/operator/previous/v0.66.0/release.yaml

Now the Tekton CRDs have been installed Later on, we will show how to configure Tekton via a TektonConfig file – but let’s discuss some theory first.

As already mentioned, the provenance must be immutable in order to reach build level three. This assumes that the user-created build steps have no ability to inject code into the source or modify the content in any way that is not intended. Therefore,  we have to take care of the Tekton pipeline. In detail this means:

  • Artifacts must be managed in a version management system.
  • When working and changing artifacts, the identities of the actors must be clear. The identity of the person who made the changes and uploaded the changes to the system and those of the person who approved the changes must be identifiable.
  • All actors involved must be verified using two-factor verification or similar authentication mechanisms.
  • Every change must be reviewed by another person before, for example, a branch can be merged into git.
  • All changes to an artifact must be traceable through a change history. This includes the identities of the people involved, the time ID of the change, a review, a description and justification for the change, the content of the change and the higher-level revisions.
  • Furthermore, the version and change history must be stored permanently and deletion must be impossible unless there is a clear and transparent policy for deletion, for example based on legal or political requirements. In addition, it should not be possible to change the history.

In order to ensure that the security chain is not interrupted, Tekton provides the option of resolvers.

Basically, a Tekton resolver is a component within the Tekton Pipelines. In the context of Tekton, a resolver is responsible for handling “references” to external sources. These external sources can be anything from Git repositories to OCI images, among others.

Tekton uses resolvers to deploy Tekton resources as tasks and pipelines from remote sources. Hence, Tekton provides resolvers to access resources in Git repositories or OCI registries, for example. Resolvers can be used for both public and private repositories.

The configuration of the provider can be divided into two parts: 

  • The first part of the configuration can be found in a ConfigMap. Tekton uses  the ConfigMap to store, among other things, standard values such as the default URL to a repository or the default Git revision, fetch timeout and API token.
  • The second part is in the PipelineRun and TaskRun definition. Within the PipelineRun and TaskRun definition, the repository URL, the revision and the path to the pipeline or task are defined under the spec field.

The following snippet shows a sample config:

<script src=https://gist.github.com/gsoeldner-sc/762d463a3b10faa752e6520e0213f6bf.js></script>

The TektonConfig can easily be deployed:

kubectl apply -f tekton-config.yaml

One disadvantage of using resolvers is that the git-resolver-configmap configuration applies to the entire cluster. Only one API token can be specified within the configuration. This means that every user of a resolver has access to the same repositories, which would make multi-tenancy impossible.

Another disadvantage is that resolvers cannot exclude the possibility that resources  not coming from a version control system may be used. To ensure that the resolvers are not bypassed, there is an option to sign resources. Policies can then check whether a resource has a valid signature. This ensures that only resources with the correct signature can be executed.

You can use the Tekton CLI tool to sign the resources.

The CLI supports signing key files with the format Elliptic Curve Digital Signature Algorithm (ecdsa), Edwards-curve 25519 (Ed25519) and Rivest-Shamir-Adleman (RSA) or a KMS including Google Cloud Platform (GCP), Amazon Web Services (AWS), Vault and Azure.

The verification of the signatures is done via policies. Filters and keys can be defined in a policy. The filters are used to define the repositories from where the pipelines and tasks can come from. Keys are used to verify the signature.

When evaluating whether one or more policies are applicable, the filters check whether the source URL matches one of the specified filters. If one or more filters apply, the corresponding guidelines are used for further review. If multiple filters apply, the resource must pass validation by all policies. The filters are specified according to the regular-expression (regex) scheme.

After filtering, the signature verification of the resources is carried out using keys. These keys can be specified in three different ways:

  • As a Kubernetes secret
  • As an encoded string,
  • Or via a KMS system 

The policies have three operating modes: ignore, warn, and fail. In “ignore” mode, a mismatch with the policy is ignored and the Tekton resource is still executed. In “warn” mode, if a mismatch occurs, a warning is generated in the logs, but the run continues to execute. In “fail” mode, the run will not start if no suitable policy is found or the resource does not pass a check.

That’s it for today. In the next part, we will talk about Pipelines and Tasks.